Abstract
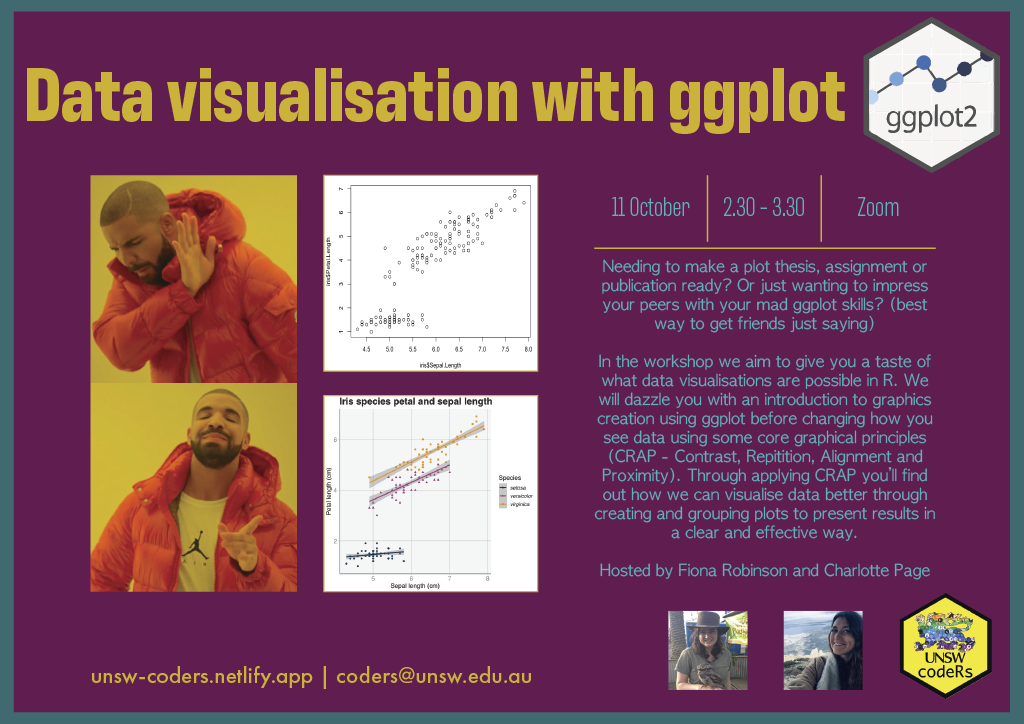
In this workshop we aim to give you a taste of what data visualisations are possible in R. We will dazzle you with an introduction to graphics creation using ggplot before changing how you see data using some core graphical principles.
In this workshop we aim to give you a taste of what data visualisations are possible in R. We will dazzle you with an introduction to graphics creation using ggplot before changing how you see data using some core graphical principles.